Mapping Chicago's 2019 NYE Rideshare Trips
Rideshare trips have been a hot topic of discussion in Chicago recently. There is debate about whether the availability of rideshare companies do anything to help or actually hurt congestion, how rideshare companies compete with public transportation, and the extent to which the negative externalities of rideshare are understood (e.g. obstructing bike lanes). This year, Lori Lightfoot (Chicago’s Mayor) introduced a new tiered taxing structure for rideshare trips that includes top-tier fees that are the highest in the nation. The tax was introduced with the goal of reducing congestion and pollution.
In this post, I’ll take a much more light-hearted look at rideshare trips in Chicago. Inspired by a talk given by Tina Cormier at rstudio::conf 2020 about how geospatial analysts have begun to embrace R as a tool, I’ll create several nifty maps to explore spatial patterns of rideshare trips in Chicago. Important disclaimer: I am not, by any definition, a geospatial analyst. But I love maps, and there are a number of new(ish) R packages that make mapping in R easy for an amateur like me.
One of the many interesting datasets available from the City of Chicago’s Open Data Portal includes information on every rideshare trip taken in the city. The city requires all Transportation Network Providers (rideshare companies) to report a number of characteristics about every trip, as well as information on every registered driver, vehicle, and driver session. This data is all available through the portal (stripped of any identifying information, of course).
As of the time of this post, the rideshare data available from the portal contained 129 million trips, way more than my laptop can handle on its own. I picked New Year’s Eve/Day 2019 to reduce the number of trips to a more manageable size for this analysis. The tradeoff here is that rideshare trips on this particular holiday are highly unlikely to be representative of the population of trips throughout time, so I certainly won’t be drawing any broad-based conclusions!
The R packages I’ll use:
library(RSocrata)
library(tidyverse)
library(kableExtra)
library(sf)
library(leaflet)
library(ggmap)
library(lubridate)
library(gganimate)
library(ggthemes)Loading the rideshare data into the R session is as simple as passing a Socrata-valid url (a query to the Socrata API) to the read.socrata() function. Information available for each trip includes the trip start and end time, duration and distance of the trip, the pickup and dropoff location, the total fare, the tip, and whether the trips of multiple riders were pooled.
# query the rideshare data
rideshare_data <- read.socrata("https://data.cityofchicago.org/resource/m6dm-c72p.json?$where=pickup_centroid_location IS NOT NULL AND dropoff_centroid_location IS NOT NULL AND (trip_start_timestamp between '2018-12-31T08:00:00.000' AND '2019-01-02T00:00:00.000')")
head(as_tibble(rideshare_data))## # A tibble: 6 x 23
## trip_id trip_start_timesta… trip_end_timestamp trip_seconds trip_miles
## <chr> <dttm> <dttm> <chr> <chr>
## 1 000302… 2018-12-31 18:15:00 2018-12-31 18:15:00 300 1.1056100…
## 2 00822e… 2018-12-31 11:00:00 2018-12-31 11:15:00 959 3.2155001…
## 3 00a09e… 2018-12-31 14:45:00 2018-12-31 15:00:00 1080 3.28147006
## 4 00bf57… 2018-12-31 19:15:00 2018-12-31 19:45:00 2400 9.0238399…
## 5 00fa68… 2018-12-31 20:00:00 2018-12-31 20:30:00 1440 6.6604599…
## 6 010a7e… 2018-12-31 16:30:00 2018-12-31 16:45:00 1020 4.7159700…
## # … with 18 more variables: pickup_census_tract <chr>,
## # dropoff_census_tract <chr>, pickup_community_area <chr>,
## # dropoff_community_area <chr>, fare <chr>, tip <chr>,
## # additional_charges <chr>, trip_total <chr>, shared_trip_authorized <chr>,
## # trips_pooled <chr>, pickup_centroid_latitude <chr>,
## # pickup_centroid_longitude <chr>, pickup_centroid_location.type <chr>,
## # pickup_centroid_location.coordinates <list>,
## # dropoff_centroid_latitude <chr>, dropoff_centroid_longitude <chr>,
## # dropoff_centroid_location.type <chr>,
## # dropoff_centroid_location.coordinates <list>Now that the data’s been loaded, I’ll perform a few manipulations to support the spatial analysis. First, I’ll read in the the community area number to name mapping from the open data portal. Community areas are Chicago’s 77 official neighborhoods and each is mapped to an integer (e.g. the Loop is community area 32). Next, I’ll load geospatial shapefiles for the 77 community areas. These shapefiles contain geocoded polygons that define the boundaries of each of the community areas. I downloaded these files locally; they’re available here.
Finally, I join the community area data to the rideshare data and derive several new variables: the total cost of the trip before tip, the tip expressed as a percentage of the cost, and the hour and day during which the trip started.
# obtain community area code to string name mapping
community_areas <- read.socrata("https://data.cityofchicago.org/resource/igwz-8jzy.json")
# read in community area shapefiles
community_area_sf <- st_read("~/kyle/Website/data/community_areas.kml",
quiet = TRUE) %>%
mutate_at("area_numbe", as.character)
# join community area strings to the rideshare data & basic data cleaning
chi_data <- left_join(rideshare_data, community_areas %>%
select(area_numbe, community),
by = c("pickup_community_area" = "area_numbe")) %>%
rename(pickup_community_char = community) %>%
left_join(community_areas,
by = c("dropoff_community_area" = "area_numbe")) %>%
rename(dropoff_community_char = community) %>%
mutate_at(c("fare", "additional_charges", "tip", "trip_miles",
"trips_pooled", "dropoff_centroid_latitude",
"dropoff_centroid_longitude", "pickup_centroid_latitude",
"pickup_centroid_longitude"), as.numeric) %>%
mutate(total_wo_tip = fare + additional_charges,
tip_pct = ifelse(tip > 0 & fare > 0, tip/total_wo_tip, NA),
hour_of_trip = lubridate::round_date(trip_start_timestamp, unit = "hour"),
day_of_trip = lubridate::round_date(trip_start_timestamp, unit = "day")
) The below code chunk creates a function that can be used to compute various summary statistics for an arbitrary number of grouping variables.
# function to compute summary stats by group
summary_stats <- function(data, ...){
group_vars <- enquos(...)
data %>%
group_by(!!! group_vars) %>%
summarise(
n_rides = n(),
log_n_rides = log(n()),
mean_cost = mean(total_wo_tip, na.rm = TRUE),
p25_cost = quantile(total_wo_tip, probs = 0.25),
med_cost = median(total_wo_tip, na.rm = TRUE),
p75_cost = quantile(total_wo_tip, probs = 0.75),
sd_cost = sd(total_wo_tip, na.rm = TRUE),
mean_distance = mean(trip_miles, na.rm = TRUE),
med_distance = median(trip_miles, na.rm = TRUE),
share_pooled = length(which(trips_pooled > 1)) / n()*100,
share_tipped = length(which(tip > 0)) / n()*100,
mean_tip_dollar = mean(tip[tip > 0], na.rm = TRUE),
mean_tip_percent = mean(tip_pct, na.rm = TRUE)*100
) %>%
mutate_if(is.numeric, round, digits = 2) %>%
arrange(desc(n_rides))
}I’ll use this function to first compute summary statistics by the hour of the day during which the ride began.
Using this data to plot the number of rides by hour reveals a large spike in the number of rides between midnight and 5am on the 1st. Not surprising that a spike in ridership would occur during this time, but the magnitude is definitely a bit striking!
# compute summary statistics by hour
summary_by_hour <- summary_stats(data = chi_data, hour_of_trip)
# plot number of rides by hour
summary_by_hour %>%
ggplot(aes(x = hour_of_trip, y = n_rides)) +
geom_line(colour = "blue") +
xlab("Time") +
ylab("No. of Rides") +
scale_x_datetime(date_breaks = "4 hours") +
ggtitle("Number of Rides per hour") +
theme_few() +
theme(legend.title = element_blank(),
legend.position = c(0.8, 0.9),
axis.text.x = element_text(angle = 45, hjust = 1))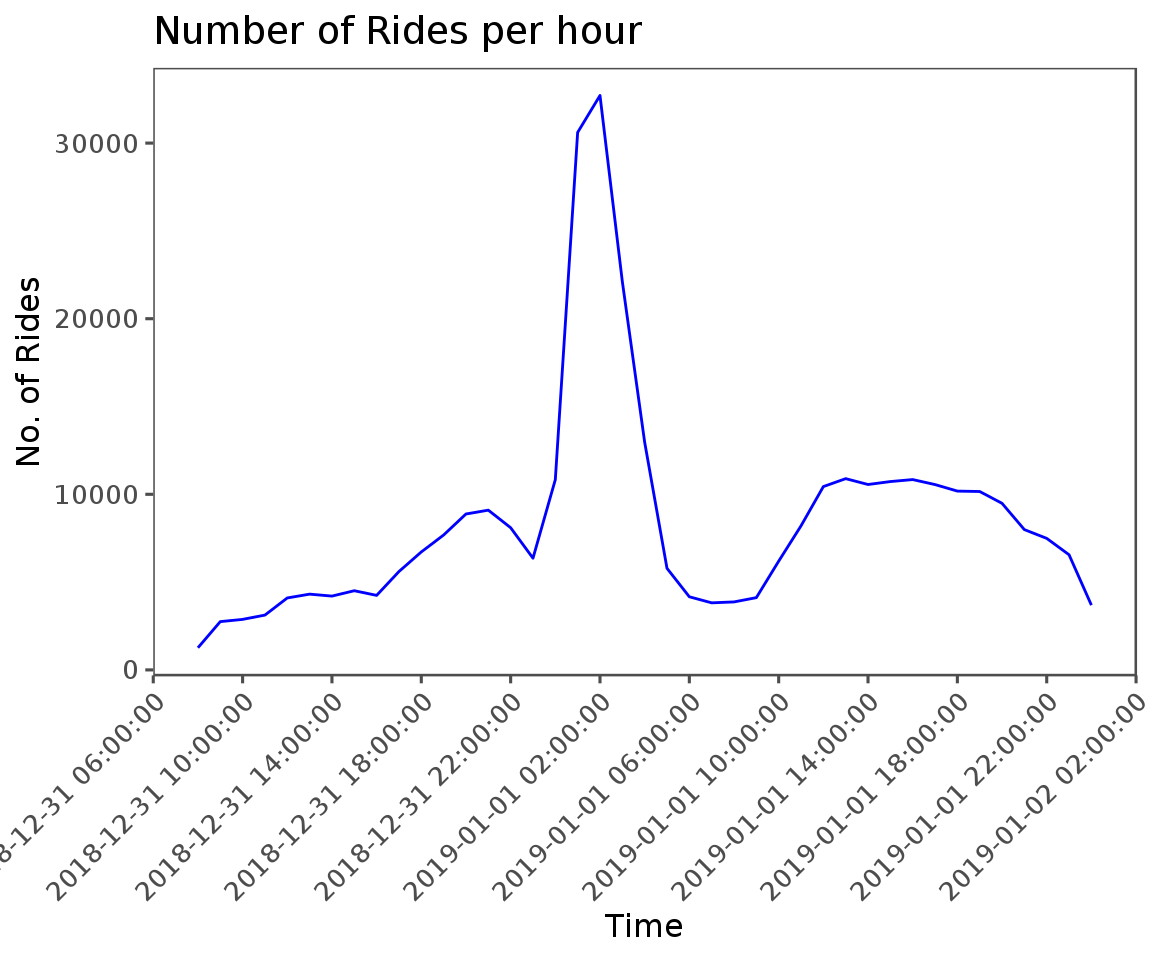
Let’s add the spatial dimension to the above picture. In the code chunk below, I use the ggmap package to first obtain a map of the Chicago area. Then, I add points to the map corresponding to the geo-coded pickup location of each rideshare trip. Finally, I use the gganimate package to create individual frames corresponding to all trips occurring in a given hour and compile all of those “hourly” frames into a gif. Pretty cool, and very simple thanks to gganimate!
With this animated map, it’s easy to observe the massive uptick in rides starting around midnight on New Year’s day.
# reference my personal google maps API key - stored in .Rprofile
register_google(google_maps_key)
chicago_raster <- get_map(location = "chicago, illinois", color = "bw")
animated_map <- ggmap(chicago_raster, zoom = 10) +
geom_point(data = chi_data,
aes(y = pickup_centroid_latitude,
x = pickup_centroid_longitude),
colour = "red") +
theme(axis.title.x = element_blank(),
axis.text.x = element_blank(),
axis.ticks.x = element_blank(),
axis.ticks.y = element_blank(),
axis.text.y = element_blank(),
axis.title.y = element_blank(),) +
transition_states(hour_of_trip) +
ggtitle("{closest_state}")
animated_map
Continuing into the realm of geospatial analysis, let’s compute the summary statistics by the community area where the ride ended. The kableExtra package provides a number of functions to produce formatted tables for HTML output.
The Near North Side (aka River North), home to a ton of bars, restaurants, and nightclubs, was the most popular rideshare dropoff destination for New Year’s 2019 by far. Those familiar with Chicago will not be surprised by the other neighborhoods at the top of the most-frequented list.
# compute summary statistics by dropoff community
dropoff_summary <-
summary_stats(data = chi_data, dropoff_community_char,
dropoff_community_area)
# print a formatted table using kableExtra
dropoff_summary %>%
kable(format = "html", digits = 2) %>%
kable_styling(bootstrap_options = c("striped", "hover")) %>%
scroll_box(height = "300px")| dropoff_community_char | dropoff_community_area | n_rides | log_n_rides | mean_cost | p25_cost | med_cost | p75_cost | sd_cost | mean_distance | med_distance | share_pooled | share_tipped | mean_tip_dollar | mean_tip_percent |
|---|---|---|---|---|---|---|---|---|---|---|---|---|---|---|
| NEAR NORTH SIDE | 8 | 60912 | 11.02 | 10.91 | 7.50 | 10.00 | 12.50 | 6.59 | 3.52 | 2.24 | 11.96 | 19.72 | 2.64 | 25.84 |
| LAKE VIEW | 6 | 35358 | 10.47 | 11.09 | 7.50 | 10.00 | 12.50 | 6.60 | 3.80 | 3.05 | 14.18 | 19.01 | 2.62 | 25.04 |
| WEST TOWN | 24 | 27551 | 10.22 | 10.60 | 7.50 | 10.00 | 12.50 | 5.78 | 3.53 | 2.89 | 14.05 | 20.00 | 2.54 | 24.85 |
| LOOP | 32 | 25333 | 10.14 | 10.98 | 7.50 | 10.00 | 12.55 | 6.42 | 3.79 | 2.17 | 14.59 | 23.13 | 2.64 | 26.18 |
| NEAR WEST SIDE | 28 | 25323 | 10.14 | 10.80 | 7.50 | 10.00 | 12.50 | 6.07 | 3.96 | 2.74 | 16.61 | 19.07 | 2.53 | 24.71 |
| LINCOLN PARK | 7 | 24636 | 10.11 | 10.66 | 7.50 | 10.00 | 12.50 | 6.37 | 3.48 | 2.58 | 13.10 | 16.71 | 2.58 | 24.79 |
| LOGAN SQUARE | 22 | 17247 | 9.76 | 10.87 | 7.50 | 10.00 | 12.50 | 5.70 | 3.71 | 3.12 | 14.05 | 23.28 | 2.58 | 25.20 |
| UPTOWN | 3 | 10501 | 9.26 | 11.56 | 7.50 | 10.00 | 12.80 | 6.98 | 4.36 | 3.32 | 16.47 | 24.47 | 2.74 | 25.49 |
| EDGEWATER | 77 | 6605 | 8.80 | 12.39 | 7.50 | 10.00 | 15.00 | 7.43 | 5.05 | 3.83 | 15.28 | 27.80 | 2.89 | 25.80 |
| NEAR SOUTH SIDE | 33 | 6271 | 8.74 | 12.77 | 7.55 | 10.05 | 15.00 | 7.39 | 4.84 | 3.51 | 16.68 | 22.07 | 2.70 | 23.06 |
| OHARE | 76 | 6185 | 8.73 | 31.46 | 27.50 | 30.05 | 32.55 | 9.96 | 16.42 | 17.31 | 6.34 | 26.65 | 4.91 | 16.01 |
| NORTH CENTER | 5 | 5511 | 8.61 | 11.05 | 7.50 | 10.00 | 12.50 | 6.25 | 3.79 | 2.91 | 13.48 | 25.73 | 2.68 | 25.76 |
| LINCOLN SQUARE | 4 | 5042 | 8.53 | 12.05 | 7.50 | 10.00 | 15.00 | 7.02 | 4.35 | 3.39 | 14.56 | 28.92 | 2.90 | 26.43 |
| AVONDALE | 21 | 4952 | 8.51 | 11.32 | 7.50 | 10.00 | 12.55 | 5.98 | 4.18 | 3.57 | 15.45 | 23.49 | 2.76 | 25.95 |
| ROGERS PARK | 1 | 4640 | 8.44 | 13.13 | 7.50 | 10.05 | 17.50 | 8.07 | 5.86 | 4.59 | 18.88 | 24.57 | 3.02 | 24.77 |
| IRVING PARK | 16 | 4449 | 8.40 | 11.96 | 7.50 | 10.05 | 15.00 | 6.26 | 4.73 | 4.07 | 16.32 | 23.15 | 2.93 | 25.96 |
| LOWER WEST SIDE | 31 | 4333 | 8.37 | 11.82 | 7.50 | 10.00 | 15.00 | 6.77 | 5.14 | 4.29 | 25.99 | 17.59 | 2.80 | 25.05 |
| HYDE PARK | 41 | 3589 | 8.19 | 14.15 | 7.50 | 12.50 | 17.50 | 9.06 | 7.35 | 7.48 | 24.97 | 19.89 | 2.99 | 21.51 |
| AUSTIN | 25 | 3203 | 8.07 | 11.91 | 7.50 | 10.00 | 15.00 | 6.71 | 5.58 | 3.94 | 30.35 | 5.18 | 2.99 | 23.91 |
| HUMBOLDT PARK | 23 | 3082 | 8.03 | 11.17 | 7.50 | 10.00 | 12.55 | 6.09 | 4.30 | 3.35 | 24.14 | 15.06 | 2.80 | 25.59 |
| ALBANY PARK | 14 | 2985 | 8.00 | 12.24 | 7.50 | 10.05 | 15.00 | 6.42 | 4.99 | 4.19 | 18.99 | 23.12 | 2.96 | 25.81 |
| GARFIELD RIDGE | 56 | 2953 | 7.99 | 25.67 | 20.67 | 27.50 | 30.05 | 9.82 | 12.20 | 12.98 | 9.18 | 26.75 | 4.59 | 17.74 |
| WEST RIDGE | 2 | 2947 | 7.99 | 12.21 | 7.50 | 10.00 | 15.05 | 7.79 | 5.53 | 3.56 | 21.58 | 16.29 | 2.96 | 24.80 |
| PORTAGE PARK | 15 | 2562 | 7.85 | 12.67 | 7.50 | 10.05 | 15.05 | 7.49 | 5.30 | 4.41 | 16.51 | 20.92 | 3.05 | 25.51 |
| SOUTH SHORE | 43 | 2525 | 7.83 | 12.50 | 7.50 | 10.05 | 15.05 | 6.90 | 6.31 | 4.76 | 30.46 | 6.65 | 3.03 | 23.85 |
| BELMONT CRAGIN | 19 | 2438 | 7.80 | 11.53 | 7.50 | 10.00 | 15.00 | 6.43 | 4.64 | 3.43 | 21.94 | 12.72 | 2.90 | 25.24 |
| BRIDGEPORT | 60 | 2308 | 7.74 | 12.00 | 7.50 | 10.00 | 15.00 | 7.37 | 5.43 | 4.59 | 23.79 | 18.80 | 2.78 | 24.43 |
| DOUGLAS | 35 | 2147 | 7.67 | 11.21 | 7.50 | 10.00 | 12.55 | 6.62 | 5.39 | 4.63 | 32.70 | 9.97 | 2.67 | 22.10 |
| GRAND BOULEVARD | 38 | 1982 | 7.59 | 11.48 | 7.50 | 10.00 | 15.00 | 7.22 | 5.75 | 5.27 | 35.32 | 7.72 | 2.65 | 21.78 |
| ARMOUR SQUARE | 34 | 1973 | 7.59 | 10.86 | 7.50 | 10.00 | 12.55 | 5.85 | 4.45 | 3.60 | 21.79 | 17.03 | 2.45 | 22.03 |
| NORTH LAWNDALE | 29 | 1823 | 7.51 | 11.13 | 7.50 | 10.00 | 12.55 | 6.35 | 5.41 | 3.94 | 35.82 | 5.70 | 2.82 | 24.02 |
| SOUTH LAWNDALE | 30 | 1773 | 7.48 | 11.62 | 7.50 | 10.05 | 15.00 | 6.09 | 5.42 | 4.62 | 27.35 | 10.94 | 2.79 | 23.40 |
| CHATHAM | 44 | 1747 | 7.47 | 11.31 | 7.50 | 10.00 | 12.55 | 7.94 | 5.23 | 3.78 | 27.02 | 4.98 | 2.75 | 22.92 |
| GREATER GRAND CROSSING | 69 | 1747 | 7.47 | 10.66 | 7.50 | 10.00 | 12.50 | 5.69 | 4.88 | 3.53 | 27.59 | 4.98 | 3.06 | 27.13 |
| KENWOOD | 39 | 1684 | 7.43 | 12.81 | 7.50 | 10.05 | 15.05 | 8.07 | 6.59 | 6.22 | 27.97 | 11.46 | 2.91 | 23.11 |
| WOODLAWN | 42 | 1583 | 7.37 | 12.03 | 7.50 | 10.00 | 15.00 | 7.31 | 6.14 | 4.39 | 32.72 | 8.72 | 2.93 | 24.32 |
| AUBURN GRESHAM | 71 | 1507 | 7.32 | 12.19 | 7.53 | 10.05 | 15.00 | 6.15 | 5.89 | 4.38 | 28.60 | 4.18 | 2.83 | 20.69 |
| EAST GARFIELD PARK | 27 | 1437 | 7.27 | 10.71 | 7.50 | 10.00 | 12.50 | 5.57 | 4.69 | 3.78 | 30.06 | 8.56 | 2.48 | 22.38 |
| CHICAGO LAWN | 66 | 1363 | 7.22 | 12.10 | 7.50 | 10.05 | 15.00 | 6.45 | 5.65 | 4.19 | 27.95 | 6.24 | 3.02 | 27.32 |
| ROSELAND | 49 | 1290 | 7.16 | 12.65 | 7.55 | 10.05 | 15.00 | 7.03 | 6.38 | 4.88 | 24.19 | 5.04 | 2.68 | 22.49 |
| NEW CITY | 61 | 1286 | 7.16 | 11.07 | 7.50 | 10.00 | 12.55 | 6.22 | 5.21 | 4.01 | 30.09 | 7.31 | 3.07 | 25.72 |
| ENGLEWOOD | 68 | 1267 | 7.14 | 10.89 | 7.50 | 10.00 | 12.55 | 5.91 | 5.08 | 3.84 | 30.23 | 3.00 | 2.29 | 23.13 |
| NORWOOD PARK | 10 | 1258 | 7.14 | 13.91 | 7.50 | 12.50 | 17.50 | 8.94 | 6.09 | 4.91 | 10.10 | 24.01 | 3.24 | 25.95 |
| BRIGHTON PARK | 58 | 1146 | 7.04 | 11.29 | 7.50 | 10.00 | 12.55 | 6.41 | 5.28 | 3.88 | 29.58 | 9.95 | 2.75 | 23.90 |
| WEST ENGLEWOOD | 67 | 1120 | 7.02 | 11.23 | 7.50 | 10.00 | 15.00 | 6.03 | 5.35 | 4.03 | 30.00 | 3.48 | 5.18 | 32.23 |
| HERMOSA | 20 | 1035 | 6.94 | 11.64 | 7.50 | 10.00 | 15.00 | 6.17 | 4.58 | 3.73 | 21.64 | 14.49 | 3.01 | 28.00 |
| JEFFERSON PARK | 11 | 1010 | 6.92 | 12.99 | 7.55 | 12.50 | 15.05 | 6.77 | 5.79 | 5.15 | 13.17 | 21.39 | 3.78 | 27.55 |
| DUNNING | 17 | 977 | 6.88 | 13.69 | 7.55 | 12.50 | 17.50 | 7.74 | 6.13 | 4.68 | 16.58 | 18.32 | 2.99 | 23.35 |
| WASHINGTON PARK | 40 | 926 | 6.83 | 10.56 | 7.50 | 10.00 | 12.55 | 5.64 | 5.26 | 4.16 | 35.21 | 4.54 | 2.31 | 23.12 |
| MCKINLEY PARK | 59 | 827 | 6.72 | 11.67 | 7.50 | 10.00 | 15.00 | 6.55 | 5.49 | 4.51 | 25.27 | 14.51 | 2.98 | 26.01 |
| GAGE PARK | 63 | 826 | 6.72 | 11.58 | 7.50 | 10.00 | 15.00 | 6.64 | 5.38 | 3.68 | 26.51 | 10.41 | 3.22 | 26.81 |
| WEST GARFIELD PARK | 26 | 817 | 6.71 | 10.40 | 7.50 | 7.55 | 12.50 | 5.90 | 4.68 | 2.93 | 32.19 | 2.57 | 2.76 | 25.45 |
| SOUTH CHICAGO | 46 | 736 | 6.60 | 13.14 | 7.50 | 12.50 | 15.11 | 7.68 | 6.25 | 4.60 | 25.41 | 4.08 | 2.73 | 23.61 |
| NORTH PARK | 13 | 724 | 6.58 | 12.97 | 7.50 | 10.05 | 15.05 | 7.87 | 5.63 | 4.31 | 22.24 | 18.65 | 2.79 | 23.60 |
| WASHINGTON HEIGHTS | 73 | 715 | 6.57 | 12.90 | 7.55 | 10.05 | 15.05 | 6.78 | 6.36 | 4.96 | 21.68 | 6.71 | 4.52 | 27.06 |
| WEST LAWN | 65 | 699 | 6.55 | 13.01 | 7.55 | 10.05 | 15.44 | 7.67 | 6.21 | 4.33 | 27.61 | 11.73 | 3.37 | 27.80 |
| ASHBURN | 70 | 669 | 6.51 | 14.81 | 10.00 | 12.55 | 17.50 | 8.28 | 7.61 | 6.01 | 30.79 | 9.87 | 3.62 | 20.51 |
| WEST PULLMAN | 53 | 609 | 6.41 | 14.31 | 7.55 | 12.55 | 17.50 | 7.77 | 7.79 | 6.33 | 22.00 | 4.27 | 2.92 | 21.00 |
| MORGAN PARK | 75 | 569 | 6.34 | 14.41 | 7.50 | 10.88 | 17.55 | 9.38 | 7.37 | 4.45 | 14.06 | 8.08 | 3.46 | 25.75 |
| FOREST GLEN | 12 | 558 | 6.32 | 14.49 | 10.00 | 12.50 | 17.50 | 7.32 | 6.69 | 6.27 | 11.47 | 23.30 | 3.15 | 21.69 |
| BEVERLY | 72 | 504 | 6.22 | 15.04 | 7.50 | 10.05 | 21.29 | 10.56 | 7.40 | 3.80 | 10.91 | 17.46 | 4.00 | 29.40 |
| CLEARING | 64 | 473 | 6.16 | 14.54 | 7.55 | 12.50 | 20.00 | 8.46 | 7.24 | 4.74 | 18.82 | 20.72 | 3.86 | 27.03 |
| ARCHER HEIGHTS | 57 | 431 | 6.07 | 12.14 | 7.50 | 10.00 | 15.03 | 7.54 | 5.79 | 4.11 | 25.06 | 13.46 | 3.59 | 25.20 |
| EDISON PARK | 9 | 418 | 6.04 | 14.68 | 7.50 | 12.50 | 20.00 | 8.90 | 6.56 | 5.68 | 9.09 | 21.29 | 4.10 | 29.13 |
| OAKLAND | 36 | 417 | 6.03 | 11.61 | 7.50 | 10.00 | 15.00 | 7.19 | 5.93 | 5.58 | 31.65 | 8.15 | 3.62 | 24.65 |
| CALUMET HEIGHTS | 48 | 409 | 6.01 | 13.30 | 7.55 | 10.24 | 15.05 | 7.65 | 6.52 | 4.62 | 26.16 | 8.56 | 3.31 | 21.98 |
| WEST ELSDON | 62 | 386 | 5.96 | 12.66 | 7.50 | 10.00 | 17.50 | 7.91 | 5.73 | 3.48 | 16.84 | 15.54 | 2.82 | 22.22 |
| MONTCLARE | 18 | 341 | 5.83 | 13.75 | 7.50 | 12.50 | 17.50 | 11.28 | 6.07 | 4.71 | 20.53 | 14.66 | 3.14 | 22.01 |
| SOUTH DEERING | 51 | 341 | 5.83 | 14.42 | 10.00 | 12.50 | 17.50 | 7.96 | 7.54 | 5.43 | 21.41 | 7.62 | 3.23 | 25.53 |
| AVALON PARK | 45 | 338 | 5.82 | 12.33 | 7.55 | 10.05 | 15.00 | 6.63 | 5.94 | 3.94 | 29.88 | 10.06 | 3.03 | 20.24 |
| FULLER PARK | 37 | 304 | 5.72 | 10.13 | 5.05 | 7.55 | 12.50 | 6.25 | 4.95 | 3.58 | 33.22 | 5.26 | 3.06 | 21.29 |
| MOUNT GREENWOOD | 74 | 270 | 5.60 | 14.88 | 7.50 | 10.00 | 20.05 | 12.28 | 7.16 | 2.58 | 5.93 | 18.89 | 3.78 | 33.94 |
| PULLMAN | 50 | 259 | 5.56 | 13.40 | 7.55 | 10.05 | 15.05 | 11.56 | 7.01 | 4.08 | 22.01 | 3.86 | 7.80 | 30.92 |
| NA | NA | 162 | 5.09 | 25.07 | 17.50 | 25.00 | 27.55 | 11.99 | 13.40 | 15.01 | 3.70 | 32.72 | 4.04 | 18.44 |
| RIVERDALE | 54 | 161 | 5.08 | 16.85 | 10.05 | 15.05 | 20.05 | 8.68 | 10.13 | 8.87 | 21.74 | 1.24 | 3.50 | 20.50 |
| EAST SIDE | 52 | 120 | 4.79 | 17.60 | 7.61 | 15.00 | 25.00 | 12.91 | 9.33 | 6.90 | 19.17 | 15.83 | 3.16 | 22.09 |
| BURNSIDE | 47 | 97 | 4.57 | 12.92 | 7.55 | 10.05 | 15.05 | 6.45 | 6.22 | 4.31 | 23.71 | 2.06 | 4.00 | 29.23 |
| HEGEWISCH | 55 | 49 | 3.89 | 20.67 | 12.28 | 15.00 | 30.16 | 12.85 | 12.35 | 6.64 | 14.29 | 16.33 | 4.50 | 22.26 |
The same suspects rise to the top of the list when computing summary statistics by the neighborhood where the ride began.
# compute summary statistics by pickup community
pickup_summary <-
summary_stats(data = chi_data, pickup_community_char,
pickup_community_area)
# print a formatted table using kableExtra
pickup_summary %>%
kable(format = "html", digits = 2) %>%
kable_styling(bootstrap_options = c("striped", "hover")) %>%
scroll_box(height = "300px")| pickup_community_char | pickup_community_area | n_rides | log_n_rides | mean_cost | p25_cost | med_cost | p75_cost | sd_cost | mean_distance | med_distance | share_pooled | share_tipped | mean_tip_dollar | mean_tip_percent |
|---|---|---|---|---|---|---|---|---|---|---|---|---|---|---|
| NEAR NORTH SIDE | 8 | 64109 | 11.07 | 11.38 | 7.50 | 10.00 | 12.55 | 7.50 | 3.65 | 2.31 | 11.91 | 19.23 | 2.78 | 26.03 |
| LAKE VIEW | 6 | 34980 | 10.46 | 10.84 | 7.50 | 10.00 | 12.50 | 6.06 | 3.72 | 2.99 | 14.21 | 19.27 | 2.63 | 24.86 |
| WEST TOWN | 24 | 28642 | 10.26 | 10.79 | 7.50 | 10.00 | 12.50 | 6.24 | 3.56 | 2.94 | 14.75 | 19.84 | 2.57 | 24.99 |
| LOOP | 32 | 25770 | 10.16 | 11.58 | 7.50 | 10.00 | 12.55 | 7.58 | 4.17 | 2.28 | 14.37 | 22.44 | 2.66 | 25.46 |
| LINCOLN PARK | 7 | 24548 | 10.11 | 10.65 | 7.50 | 10.00 | 12.50 | 6.20 | 3.39 | 2.59 | 12.86 | 18.06 | 2.69 | 25.08 |
| NEAR WEST SIDE | 28 | 24234 | 10.10 | 10.90 | 7.50 | 10.00 | 12.50 | 6.59 | 3.92 | 2.84 | 17.02 | 18.16 | 2.65 | 25.39 |
| LOGAN SQUARE | 22 | 18324 | 9.82 | 11.04 | 7.50 | 10.00 | 12.50 | 5.91 | 3.78 | 3.19 | 14.67 | 23.54 | 2.59 | 24.69 |
| UPTOWN | 3 | 10313 | 9.24 | 11.29 | 7.50 | 10.00 | 12.80 | 6.08 | 4.34 | 3.38 | 15.81 | 25.69 | 2.70 | 25.01 |
| OHARE | 76 | 6665 | 8.80 | 30.86 | 27.50 | 30.05 | 35.00 | 9.11 | 16.20 | 16.52 | 14.06 | 22.51 | 4.81 | 15.68 |
| NEAR SOUTH SIDE | 33 | 6368 | 8.76 | 12.31 | 7.50 | 10.05 | 15.00 | 6.84 | 4.72 | 3.26 | 16.38 | 22.49 | 2.74 | 24.19 |
| EDGEWATER | 77 | 5998 | 8.70 | 11.24 | 7.50 | 10.00 | 15.00 | 6.08 | 4.59 | 3.24 | 15.29 | 28.78 | 2.74 | 26.44 |
| NORTH CENTER | 5 | 5289 | 8.57 | 11.28 | 7.50 | 10.00 | 12.55 | 6.22 | 3.93 | 2.96 | 13.16 | 27.64 | 2.76 | 25.93 |
| AVONDALE | 21 | 5184 | 8.55 | 11.18 | 7.50 | 10.00 | 12.55 | 5.45 | 4.25 | 3.61 | 15.55 | 23.82 | 2.67 | 24.60 |
| LINCOLN SQUARE | 4 | 4709 | 8.46 | 11.16 | 7.50 | 10.00 | 12.55 | 5.60 | 4.18 | 3.22 | 13.25 | 31.15 | 2.71 | 26.37 |
| LOWER WEST SIDE | 31 | 4475 | 8.41 | 11.51 | 7.50 | 10.00 | 15.00 | 5.89 | 5.19 | 4.45 | 25.34 | 18.32 | 2.70 | 24.37 |
| IRVING PARK | 16 | 4257 | 8.36 | 11.61 | 7.50 | 10.05 | 15.00 | 5.42 | 4.75 | 4.03 | 15.34 | 23.87 | 2.80 | 25.61 |
| ROGERS PARK | 1 | 4093 | 8.32 | 11.84 | 7.50 | 10.00 | 15.00 | 6.76 | 5.35 | 3.62 | 17.52 | 24.80 | 2.65 | 24.73 |
| GARFIELD RIDGE | 56 | 3734 | 8.23 | 26.38 | 22.50 | 26.16 | 30.50 | 9.81 | 12.66 | 12.85 | 13.55 | 24.02 | 4.40 | 16.56 |
| AUSTIN | 25 | 3136 | 8.05 | 11.71 | 7.50 | 10.00 | 15.00 | 6.52 | 5.51 | 3.68 | 30.58 | 5.45 | 3.00 | 23.67 |
| HYDE PARK | 41 | 3079 | 8.03 | 12.58 | 7.50 | 10.05 | 17.50 | 7.47 | 6.60 | 6.74 | 26.53 | 21.24 | 2.88 | 22.31 |
| HUMBOLDT PARK | 23 | 2992 | 8.00 | 10.82 | 7.50 | 10.00 | 12.55 | 5.44 | 4.27 | 3.28 | 24.43 | 15.04 | 2.64 | 24.52 |
| ALBANY PARK | 14 | 2638 | 7.88 | 11.81 | 7.50 | 10.05 | 15.00 | 5.55 | 4.85 | 3.87 | 14.59 | 22.86 | 2.88 | 26.61 |
| WEST RIDGE | 2 | 2637 | 7.88 | 11.59 | 7.50 | 10.00 | 15.00 | 6.86 | 5.30 | 3.28 | 22.94 | 16.31 | 2.73 | 24.49 |
| PORTAGE PARK | 15 | 2408 | 7.79 | 11.83 | 7.50 | 10.05 | 15.00 | 5.44 | 5.06 | 4.06 | 15.57 | 20.68 | 3.00 | 26.93 |
| BELMONT CRAGIN | 19 | 2342 | 7.76 | 11.39 | 7.50 | 10.00 | 15.00 | 5.80 | 4.68 | 3.36 | 21.56 | 13.19 | 2.73 | 26.39 |
| SOUTH SHORE | 43 | 2342 | 7.76 | 11.97 | 7.50 | 10.05 | 15.00 | 6.05 | 6.08 | 4.47 | 30.32 | 5.38 | 3.06 | 24.01 |
| BRIDGEPORT | 60 | 2259 | 7.72 | 11.68 | 7.50 | 10.05 | 15.00 | 6.24 | 5.64 | 4.90 | 23.99 | 19.21 | 2.84 | 25.20 |
| ARMOUR SQUARE | 34 | 2013 | 7.61 | 10.80 | 7.50 | 10.00 | 12.55 | 5.64 | 4.53 | 3.38 | 19.27 | 17.19 | 2.52 | 24.21 |
| GRAND BOULEVARD | 38 | 1945 | 7.57 | 10.79 | 7.50 | 10.00 | 15.00 | 6.09 | 5.52 | 4.88 | 35.27 | 6.58 | 2.61 | 22.86 |
| DOUGLAS | 35 | 1874 | 7.54 | 10.94 | 7.50 | 10.00 | 13.17 | 6.11 | 5.63 | 4.90 | 33.51 | 10.25 | 2.73 | 23.02 |
| NORTH LAWNDALE | 29 | 1824 | 7.51 | 10.79 | 7.50 | 10.00 | 12.55 | 5.88 | 5.28 | 3.85 | 36.40 | 4.66 | 3.16 | 28.61 |
| GREATER GRAND CROSSING | 69 | 1775 | 7.48 | 10.48 | 7.50 | 10.00 | 12.50 | 5.09 | 4.88 | 3.51 | 27.94 | 3.94 | 2.93 | 28.19 |
| CHATHAM | 44 | 1700 | 7.44 | 11.20 | 7.50 | 10.00 | 12.55 | 7.77 | 5.11 | 3.63 | 24.94 | 5.59 | 2.36 | 21.83 |
| SOUTH LAWNDALE | 30 | 1608 | 7.38 | 11.24 | 7.50 | 10.00 | 15.00 | 5.68 | 5.26 | 4.28 | 26.80 | 10.76 | 2.78 | 24.36 |
| WOODLAWN | 42 | 1543 | 7.34 | 11.18 | 7.50 | 10.00 | 15.00 | 6.06 | 5.77 | 4.07 | 32.27 | 7.65 | 2.89 | 25.23 |
| AUBURN GRESHAM | 71 | 1469 | 7.29 | 12.34 | 7.50 | 10.05 | 15.00 | 6.81 | 5.99 | 4.25 | 26.82 | 4.29 | 2.70 | 21.17 |
| EAST GARFIELD PARK | 27 | 1445 | 7.28 | 11.09 | 7.50 | 10.00 | 12.55 | 6.06 | 5.08 | 3.86 | 30.10 | 8.30 | 2.48 | 19.65 |
| KENWOOD | 39 | 1441 | 7.27 | 12.10 | 7.50 | 10.05 | 15.00 | 7.64 | 6.45 | 5.77 | 32.34 | 12.14 | 2.50 | 23.10 |
| ROSELAND | 49 | 1308 | 7.18 | 12.15 | 7.50 | 10.05 | 15.00 | 6.07 | 6.07 | 4.55 | 24.16 | 5.28 | 2.59 | 19.67 |
| CHICAGO LAWN | 66 | 1307 | 7.18 | 11.91 | 7.50 | 10.00 | 15.00 | 6.23 | 5.63 | 4.27 | 30.60 | 6.66 | 2.91 | 24.10 |
| ENGLEWOOD | 68 | 1307 | 7.18 | 10.60 | 7.50 | 10.00 | 12.55 | 5.28 | 5.08 | 3.83 | 30.68 | 4.44 | 2.24 | 19.31 |
| NEW CITY | 61 | 1251 | 7.13 | 10.65 | 7.50 | 10.00 | 12.55 | 5.04 | 5.20 | 4.04 | 29.42 | 7.59 | 2.29 | 22.45 |
| BRIGHTON PARK | 58 | 1128 | 7.03 | 10.81 | 7.50 | 10.00 | 12.55 | 5.27 | 5.09 | 3.71 | 27.84 | 9.31 | 2.44 | 24.15 |
| WEST ENGLEWOOD | 67 | 1100 | 7.00 | 11.60 | 7.50 | 10.00 | 15.00 | 6.25 | 5.69 | 4.32 | 34.27 | 3.73 | 5.76 | 30.65 |
| NORWOOD PARK | 10 | 1073 | 6.98 | 12.21 | 7.50 | 10.00 | 15.30 | 6.05 | 5.36 | 3.77 | 8.48 | 22.74 | 2.89 | 25.11 |
| HERMOSA | 20 | 1047 | 6.95 | 11.54 | 7.50 | 10.00 | 15.00 | 5.70 | 4.68 | 3.68 | 22.45 | 14.61 | 2.82 | 26.08 |
| WASHINGTON PARK | 40 | 903 | 6.81 | 10.48 | 7.50 | 10.00 | 12.55 | 5.39 | 5.32 | 4.03 | 30.79 | 4.32 | 2.26 | 20.72 |
| JEFFERSON PARK | 11 | 894 | 6.80 | 11.97 | 7.50 | 10.05 | 15.00 | 5.17 | 5.06 | 4.40 | 10.63 | 23.15 | 2.79 | 24.30 |
| WEST GARFIELD PARK | 26 | 855 | 6.75 | 10.39 | 7.50 | 7.55 | 12.50 | 5.64 | 4.92 | 2.96 | 31.93 | 2.92 | 2.28 | 20.29 |
| MCKINLEY PARK | 59 | 840 | 6.73 | 11.33 | 7.50 | 10.00 | 15.00 | 6.14 | 5.52 | 4.47 | 24.05 | 14.17 | 2.87 | 22.79 |
| DUNNING | 17 | 832 | 6.72 | 13.15 | 7.55 | 10.05 | 17.50 | 7.27 | 5.93 | 4.51 | 16.71 | 19.95 | 3.46 | 27.51 |
| GAGE PARK | 63 | 802 | 6.69 | 11.07 | 7.50 | 10.00 | 12.55 | 6.33 | 4.99 | 3.30 | 27.56 | 9.73 | 3.04 | 27.07 |
| SOUTH CHICAGO | 46 | 743 | 6.61 | 12.57 | 7.50 | 10.05 | 15.05 | 6.67 | 6.20 | 4.45 | 29.61 | 5.65 | 2.93 | 24.14 |
| WASHINGTON HEIGHTS | 73 | 685 | 6.53 | 12.82 | 7.55 | 10.05 | 15.05 | 6.82 | 6.60 | 4.79 | 24.23 | 5.55 | 3.50 | 24.34 |
| WEST LAWN | 65 | 632 | 6.45 | 12.42 | 7.50 | 10.05 | 15.05 | 6.91 | 6.03 | 3.98 | 27.22 | 12.34 | 3.29 | 28.06 |
| NORTH PARK | 13 | 626 | 6.44 | 12.78 | 7.55 | 10.05 | 15.24 | 6.72 | 5.76 | 4.23 | 16.77 | 19.33 | 2.88 | 23.16 |
| ASHBURN | 70 | 625 | 6.44 | 14.28 | 10.00 | 12.51 | 17.50 | 7.01 | 7.46 | 5.77 | 26.72 | 7.84 | 3.90 | 25.81 |
| WEST PULLMAN | 53 | 582 | 6.37 | 14.29 | 7.55 | 12.55 | 17.50 | 7.94 | 7.59 | 6.14 | 21.99 | 4.64 | 3.26 | 22.14 |
| MORGAN PARK | 75 | 527 | 6.27 | 13.47 | 7.50 | 10.05 | 17.50 | 8.49 | 6.85 | 3.99 | 13.47 | 9.30 | 3.65 | 27.59 |
| ARCHER HEIGHTS | 57 | 436 | 6.08 | 11.94 | 7.50 | 10.00 | 12.55 | 10.00 | 5.53 | 3.77 | 25.69 | 12.39 | 3.28 | 28.14 |
| BEVERLY | 72 | 405 | 6.00 | 13.52 | 7.50 | 10.00 | 17.55 | 9.29 | 6.35 | 3.09 | 6.17 | 17.28 | 3.53 | 29.33 |
| FOREST GLEN | 12 | 403 | 6.00 | 13.72 | 10.00 | 12.50 | 17.50 | 6.23 | 6.21 | 5.52 | 10.17 | 26.05 | 2.97 | 19.94 |
| OAKLAND | 36 | 390 | 5.97 | 11.36 | 7.50 | 10.00 | 15.00 | 6.48 | 6.04 | 5.47 | 32.31 | 6.92 | 2.59 | 27.13 |
| FULLER PARK | 37 | 389 | 5.96 | 10.09 | 7.50 | 7.55 | 12.50 | 5.55 | 5.01 | 3.54 | 32.39 | 5.66 | 1.73 | 22.40 |
| CLEARING | 64 | 374 | 5.92 | 13.62 | 7.50 | 11.00 | 17.50 | 7.78 | 6.73 | 4.45 | 20.59 | 17.65 | 3.52 | 28.66 |
| WEST ELSDON | 62 | 364 | 5.90 | 11.54 | 7.50 | 10.00 | 15.00 | 7.38 | 5.30 | 3.22 | 23.90 | 11.54 | 2.90 | 25.33 |
| EDISON PARK | 9 | 347 | 5.85 | 12.86 | 7.50 | 10.05 | 17.50 | 6.83 | 5.64 | 4.08 | 5.19 | 23.34 | 3.20 | 26.84 |
| CALUMET HEIGHTS | 48 | 337 | 5.82 | 12.61 | 7.55 | 10.05 | 15.02 | 7.11 | 6.15 | 4.14 | 22.85 | 7.42 | 2.72 | 21.70 |
| SOUTH DEERING | 51 | 335 | 5.81 | 13.23 | 8.61 | 12.50 | 15.15 | 6.23 | 6.86 | 5.43 | 24.78 | 8.96 | 3.03 | 32.84 |
| MONTCLARE | 18 | 332 | 5.81 | 12.75 | 7.50 | 10.16 | 17.50 | 6.76 | 5.52 | 4.60 | 19.58 | 12.65 | 2.71 | 22.48 |
| AVALON PARK | 45 | 319 | 5.77 | 11.89 | 7.55 | 10.00 | 15.00 | 5.39 | 5.73 | 3.97 | 22.88 | 5.64 | 2.28 | 18.66 |
| PULLMAN | 50 | 263 | 5.57 | 12.74 | 7.55 | 10.05 | 15.00 | 9.74 | 6.42 | 4.26 | 17.49 | 7.98 | 5.14 | 25.48 |
| MOUNT GREENWOOD | 74 | 253 | 5.53 | 12.73 | 7.50 | 10.00 | 15.00 | 9.57 | 5.64 | 2.47 | 3.56 | 20.16 | 3.04 | 29.86 |
| NA | NA | 168 | 5.12 | 21.67 | 17.50 | 22.50 | 25.05 | 8.67 | 12.29 | 13.51 | 3.57 | 23.21 | 3.97 | 21.03 |
| RIVERDALE | 54 | 143 | 4.96 | 16.81 | 10.05 | 15.00 | 20.00 | 8.69 | 10.30 | 9.15 | 24.48 | 1.40 | 2.50 | 12.86 |
| BURNSIDE | 47 | 112 | 4.72 | 11.48 | 7.55 | 10.05 | 12.55 | 4.98 | 4.90 | 3.73 | 16.96 | 4.46 | 3.20 | 25.36 |
| EAST SIDE | 52 | 105 | 4.65 | 16.53 | 7.77 | 12.62 | 26.24 | 10.40 | 9.05 | 5.14 | 18.10 | 16.19 | 2.47 | 16.76 |
| HEGEWISCH | 55 | 47 | 3.85 | 20.02 | 10.57 | 15.05 | 27.52 | 11.89 | 12.11 | 9.64 | 10.64 | 21.28 | 4.20 | 21.07 |
Enough with exploring these statistics in tabular form! We are here for maps.
I’ve written a function below that serves as a wrapper for the leaflet R package, an amazingly convenient tool for creating beautiful, interactive maps in R. As a beginner, I could not have found the package documentation more friendly. I encourage you to give it a try for your own mapping fun.
The wrapper below allows me to programmatically pass different summary statistics to create a chloropleth map - color coding each neighborhood corresponding to the value of the summary statistic.
library(leaflet)
create_map <- function(data, fill_var, label_var, caption){
fill_var_quo <- enquo(fill_var)
label_var_quo <- enquo(label_var)
pal <- colorNumeric("YlOrRd", domain = data %>%
as_tibble() %>%
select(!! fill_var_quo))
# crate labels for mouse hover
labels <- data %>%
as_tibble %>%
transmute(labels = purrr::pmap(list(x = dropoff_community_char,
y = !! label_var_quo),
function(x, y) {
paste0(x,
"<br/>", format(y, big.mark = ","),
" ", caption)
})) %>%
unlist(use.names = FALSE) %>%
purrr::map(htmltools::HTML)
# map
rlang::eval_tidy(rlang::quo_squash(quo({
data %>%
leaflet() %>%
setView(lng = -87.679365,
lat = 41.840675,
zoom = 9.7) %>%
# addTiles() %>%
addProviderTiles(providers$Stamen.Toner) %>%
addPolygons(
data = data,
fillColor = ~pal(!!fill_var_quo),
weight = 2,
opacity = 1,
color = "white",
dashArray = "3",
fillOpacity = 0.7,
highlight = highlightOptions(
weight = 5,
color = "#666",
dashArray = "",
fillOpacity = 0.7,
bringToFront = TRUE
),
label = labels,
labelOptions = labelOptions(
style = list("font-weight" = "normal", padding = "3px 8px"),
textsize = "15px",
direction = "auto"
)
)
})))
}Below, I’ll use the summary statistics by dropoff community, the community area shapefiles we loaded earlier, and the wrapper function for the leaflet package (directly above) to spatially visualize several interesting metrics. Please note you can hover over each community area for the name and numeric value of each statistic.
Remember that the data underlying these maps only includes New Year’s Eve/Day 2019 and that the demographics of rideshare trips taken during this time are almost definitely not representative of the entire population over time. Any inference drawn from this analysis would definitely be subject to selection bias. With enough computing power, it would be a lot of fun to conduct a similar and deeper analysis of all available rideshare trips in Chicago.
Thanks for following along! Hopefully I’ve convinced you that making beautiful maps in R is a straightforward task.
# join the community area shapefiles to the dropoff summary stats
dropoff_summary_sp <- community_area_sf %>%
left_join(dropoff_summary #%>%
# filter(dropoff_community_char != "OHARE")
,
by = c("area_numbe" = "dropoff_community_area")) %>%
as_Spatial()
# map by number of dropoff rides
create_map(data = dropoff_summary_sp, fill_var = log_n_rides,
label_var = n_rides, caption = " count of rides dropped off")# by avg cost
create_map(data = dropoff_summary_sp, fill_var = mean_cost,
label_var = mean_cost, caption = " average cost per ride (dollars)")# by avg distance
create_map(data = dropoff_summary_sp, fill_var = mean_distance,
label_var = mean_distance, caption = " average miles per ride")# by avg tip (percent) - for rides that are tipped
create_map(data = dropoff_summary_sp, fill_var = mean_tip_percent,
label_var = mean_tip_percent, caption = " average tip (% of total cost)")# by share that are tipped
create_map(data = dropoff_summary_sp, fill_var = share_tipped,
label_var = share_tipped, caption = " share of rides that are tipped (%)")# by share of rides that were pooled
create_map(data = dropoff_summary_sp, fill_var = share_pooled,
label_var = share_pooled, caption = " share of rides were pooled (%)")